
New Product: Stock Screener
Investor’s Business Daily // 2018
Part of Investor’s Business Daily’s digital product suite were cheaper products called eTables and Top-Rated Stocks Under $10. Support and resources had been cut for years but they still maintained data for a dedicated user base. The executives decided it was time to sunset these products, but tasked me with identifying exactly why the users preferred these products to their more popular flagship product IBD Digital.
After running some on site surveys, user interviews and deep diving into the products, I discovered the users were attracted to a few things: the cheaper price point, the premium stock lists, and stock list functionality that didn’t exist in the IBD Digital product. From here it was clear there was opportunity to not just sunset these products, but build something better.
“How might we encourage users to shift from older products to the flagship IBD Digital product?”
For confidentiality reasons I have omitted certain metrics

My Role
Lead UX/UI Design
User Research + Data
Conceptualization
Team
One Designer (me)
One Engineer
One Project Manager
Timeframe
Apr - Sep 2018
5 Months
Tools & Testing
Sketch, Invision, Qualtrics
Quick Summary
The Challenge
IBD had multiple subscription options, one of which contained two tools that were no longer supported or mobile-friendly. The challenge was to identify what the small but dedicated users loved about these products, and how we could incorporate that into the other product, therefore simplifying the product line, limiting resources dedicated to outdated tools, and giving the users what they wanted.
The Solution
After running surveys and speaking to the power users I was able to better understand the use cases. At a high level, these outdated tools provided the ability to screen stocks better than investors.com allowed. Users viewed them as minified versions of the Marketsmith tool (a powerful stock research platform run by IBD’s parent company).
Myself and my project manager set out to build a powerful stock screening tool that wouldn’t cannibalize Marketsmith, but would give users all the IBD proprietary information in one intuitive package.
How I Contributed
Since the products being replaced were so old, they had no tracking or analytics. To account for this, I created and ran onsite surveys using Qualtrics to better understand usage
Worked with our customer support team to reach out to users and speak with them about their usage of eTables and Top Stocks
Identified value of products IBD wanted to sunset, and conceptualized a brand new stock research tool
Presented findings, designs, and idea to President and Executive team for approval
Ideated and delivered an immensely complex product under a high pressure timeline with no room for error
Designed new product from concept to wireframes to high fidelity and worked directly with our engineers to realize it
Ran in-person usability tests to validate the concept and ensure our users found it valuable prior to development
Owned the entire project from start to finish


Project Details
The Challenge
The users still using eTables enjoyed the lower price point and premium stock filters, however were frustrated with the outdated UI, lack of responsive design, and usability issues. They also couldn’t simply upgrade to the flagship IBD Digital subscription because they’d be paying more for less powerful stock research tools and filters. We needed to find a way to enhance the features they loved and incorporate them into the new platform.
Initial Steps
Assessing The Situation
eTables and Top-Rated Stocks Under $10 were two tools created by Investors Business Daily in order to provide users with more options when researching stocks; the former more DIY, the latter more hands off. However over the years the audience had dwindled to too small of a number to justify keeping them, although regardless how small or how unintuitive these products were, the audience was using these tools daily. Since Top-Rated Stocks Under $10 was essentially just a stock list based on specific criteria, I turned my focus to eTables.

About eTables
Price point of $16.95/Mo. makes it accessible to all levels of investors
Built in unique filters (Comp 95+, etc.)
Shows users what stocks are on multiple lists
Referred to by MarketSmith Coaches and customers as a “MarketSmith Lite”
Premium Analysis
Desktop only
Surveying The Power Users
Much to my surprise, nobody internally had any insight into eTables other than that they couldn’t believe it was still up and running. Thankfully IBD used a vendor called Qualtrics which allowed me to build some on-site surveys to gather some quantitative data.
How often do you use eTables?
First thing was to establish how frequently these users were visiting eTables in order to contextualize their answers.

What is your favorite primary sorting method?
eTables had limited functionality, the primary being sorting stocks by certain proprietary criteria

Please rank the information most important to you in eTables
As a rule of thumb, what users say vs. what they do usually don’t align. However I wanted to see if there were any usage patterns

Anything else?
The short answer field turned out to be very helpful to get an overall idea of sentiment towards eTables as a whole

First action when opening eTables
eTables was on such an outdated codebase that it was incapable of providing analytics. To try and account for this, I included a heat-map question in the survey.

Other IBD Subscriptions
To gather as much information on the eTables users as possible, we wanted to verify their engagement with other IBD products to try and gauge their experience with investing

What We Learned

Users visit eTables more than internally thought
Initially it was thought that etables wasn’t used at all, however we found that 55% checked it daily, and 33% weekly. Now we just had to find out why!
Insight:
Speak with the daily users to better understand their use cases

Users found value in surprising places
It turned out that users preferred eTables to IBD Digital partly because it was so untouched. There were no ads or popups, and even though the UI was outdated the valuable stock lists and powerful filters made it worth it.
Insight:
Users found the most value in stock lists, unique filters, proprietary stock analysis, and lack of disruptive ads

Majority of users ended up exporting to other tools
After speaking with users it turned out the most common use case was to use the proprietary filters to create a list, export that list, then open it in another investment tool with more diverse filtering.
Insight:
Essentially, users found value in the stock insights and information, but found more robust filtering elsewhere, so they were forced to export the lists to non-IBD tools
Proof of Concept
It was clear that we needed to sunset these outdated products, but there was still value that we didn’t want to lose. I put together a presentation for the President of IBD and a few other executives to share my insights and propose a redesign.
eTables.com, 2018

Redesigned New Product

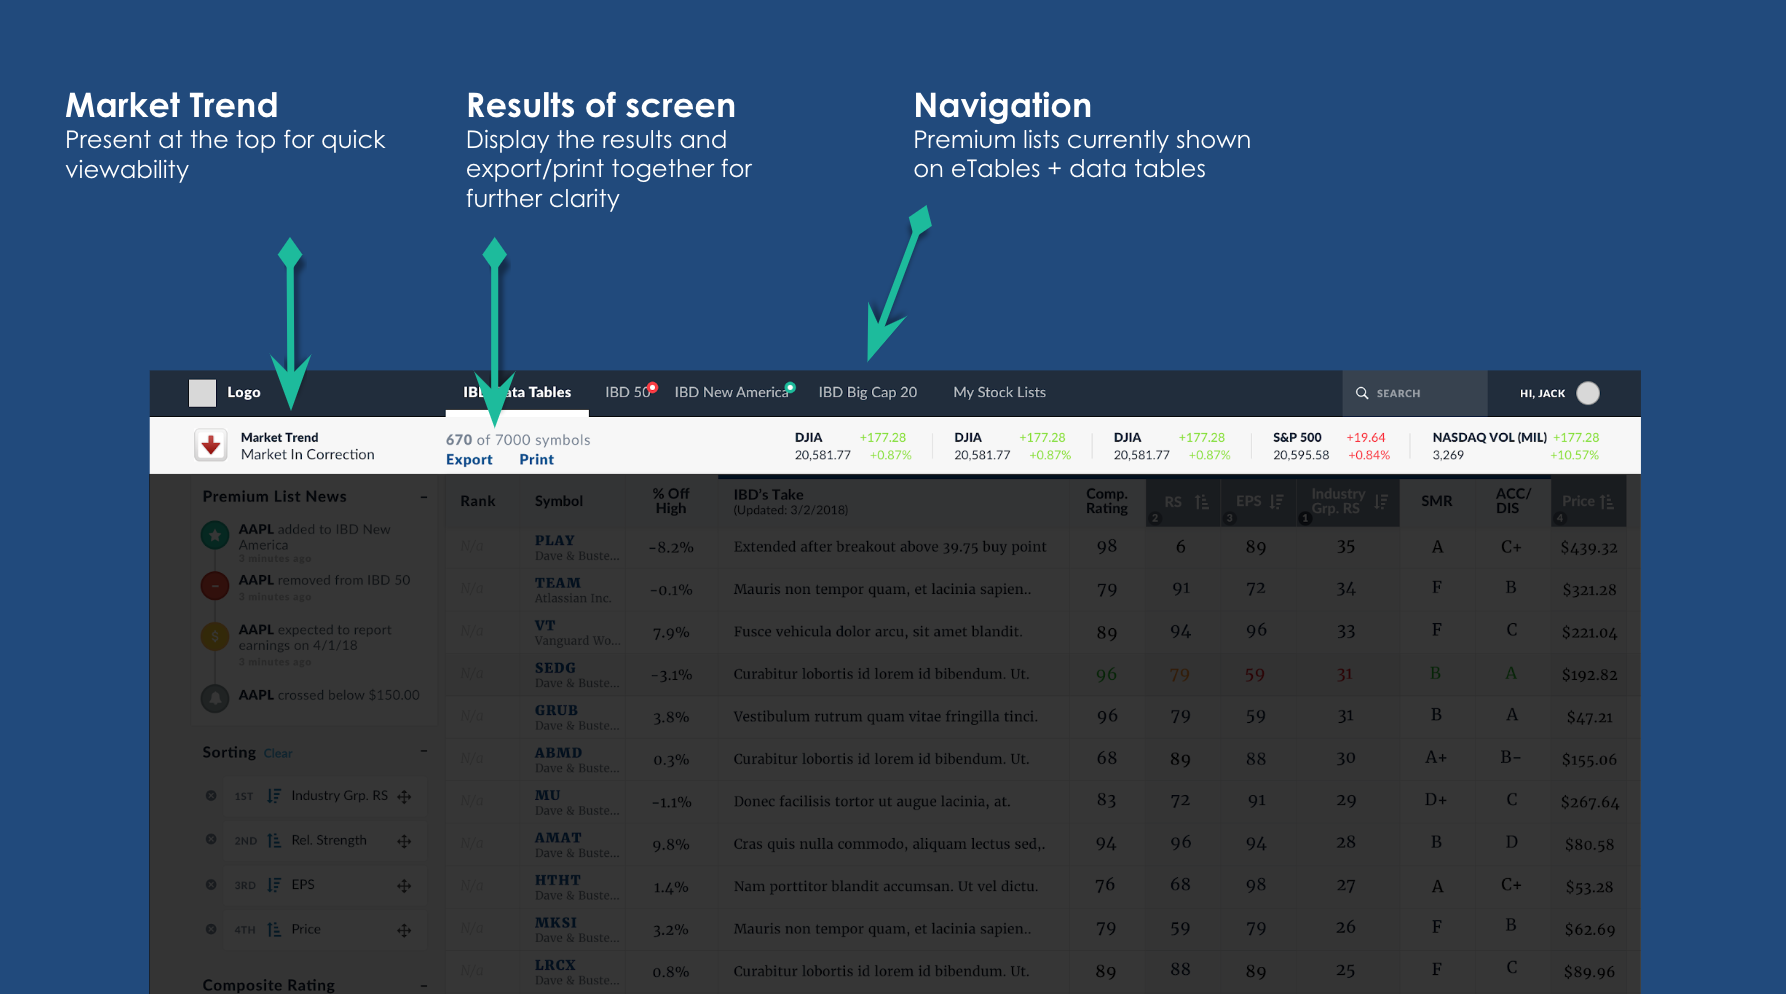
Enhanced navigation bar

Improved usability and stock screening

More useful categories to prevent need for exporting lists

eTables chart analysis (top value for users) was hidden behind a click. The goal was to surface this in the redesign

Quick stock analysis side panel with IBD's proprietary Smart Select Ratings

Breakdown of side panel information
User Testing and Validation
Since this project was being done (at the request of IBD’s current president) in a silo, the designs came before any user testing. However now that the executive team was aligned on the proof of concept, I could create a robust prototype to show to users.
External testing with a prototype
This first round of usability testing was done at one of the Investor’s Business Daily meetups. My project manager and I drove up to San Rafael, CA. from Los Angeles to join in and speak to the users.
Since we were only testing a prototype we kept the tasks relatively simple and focused on the tasks most critical to a user journey (sorting stocks, applying filters, opening the side panel, viewing lists, etc).

What did we learn?
Overall the product was incredibly well received! The majority of the feedback was around how much it would cost, which was a good chance to gain insight as to what they would be willing to pay. Some other feedback included:
Ability to create custom columns based on formulas
Premium lists as columns (it was more important if a stock is on a premium list or not)
Stock comparison interface
Extra columns that IBD didn’t currently support
Ability to customize color the scheme of charts
Technical Scoping
Now that we had actual user feedback on a working product we could prioritize what was needed for launch with a feature value matrix
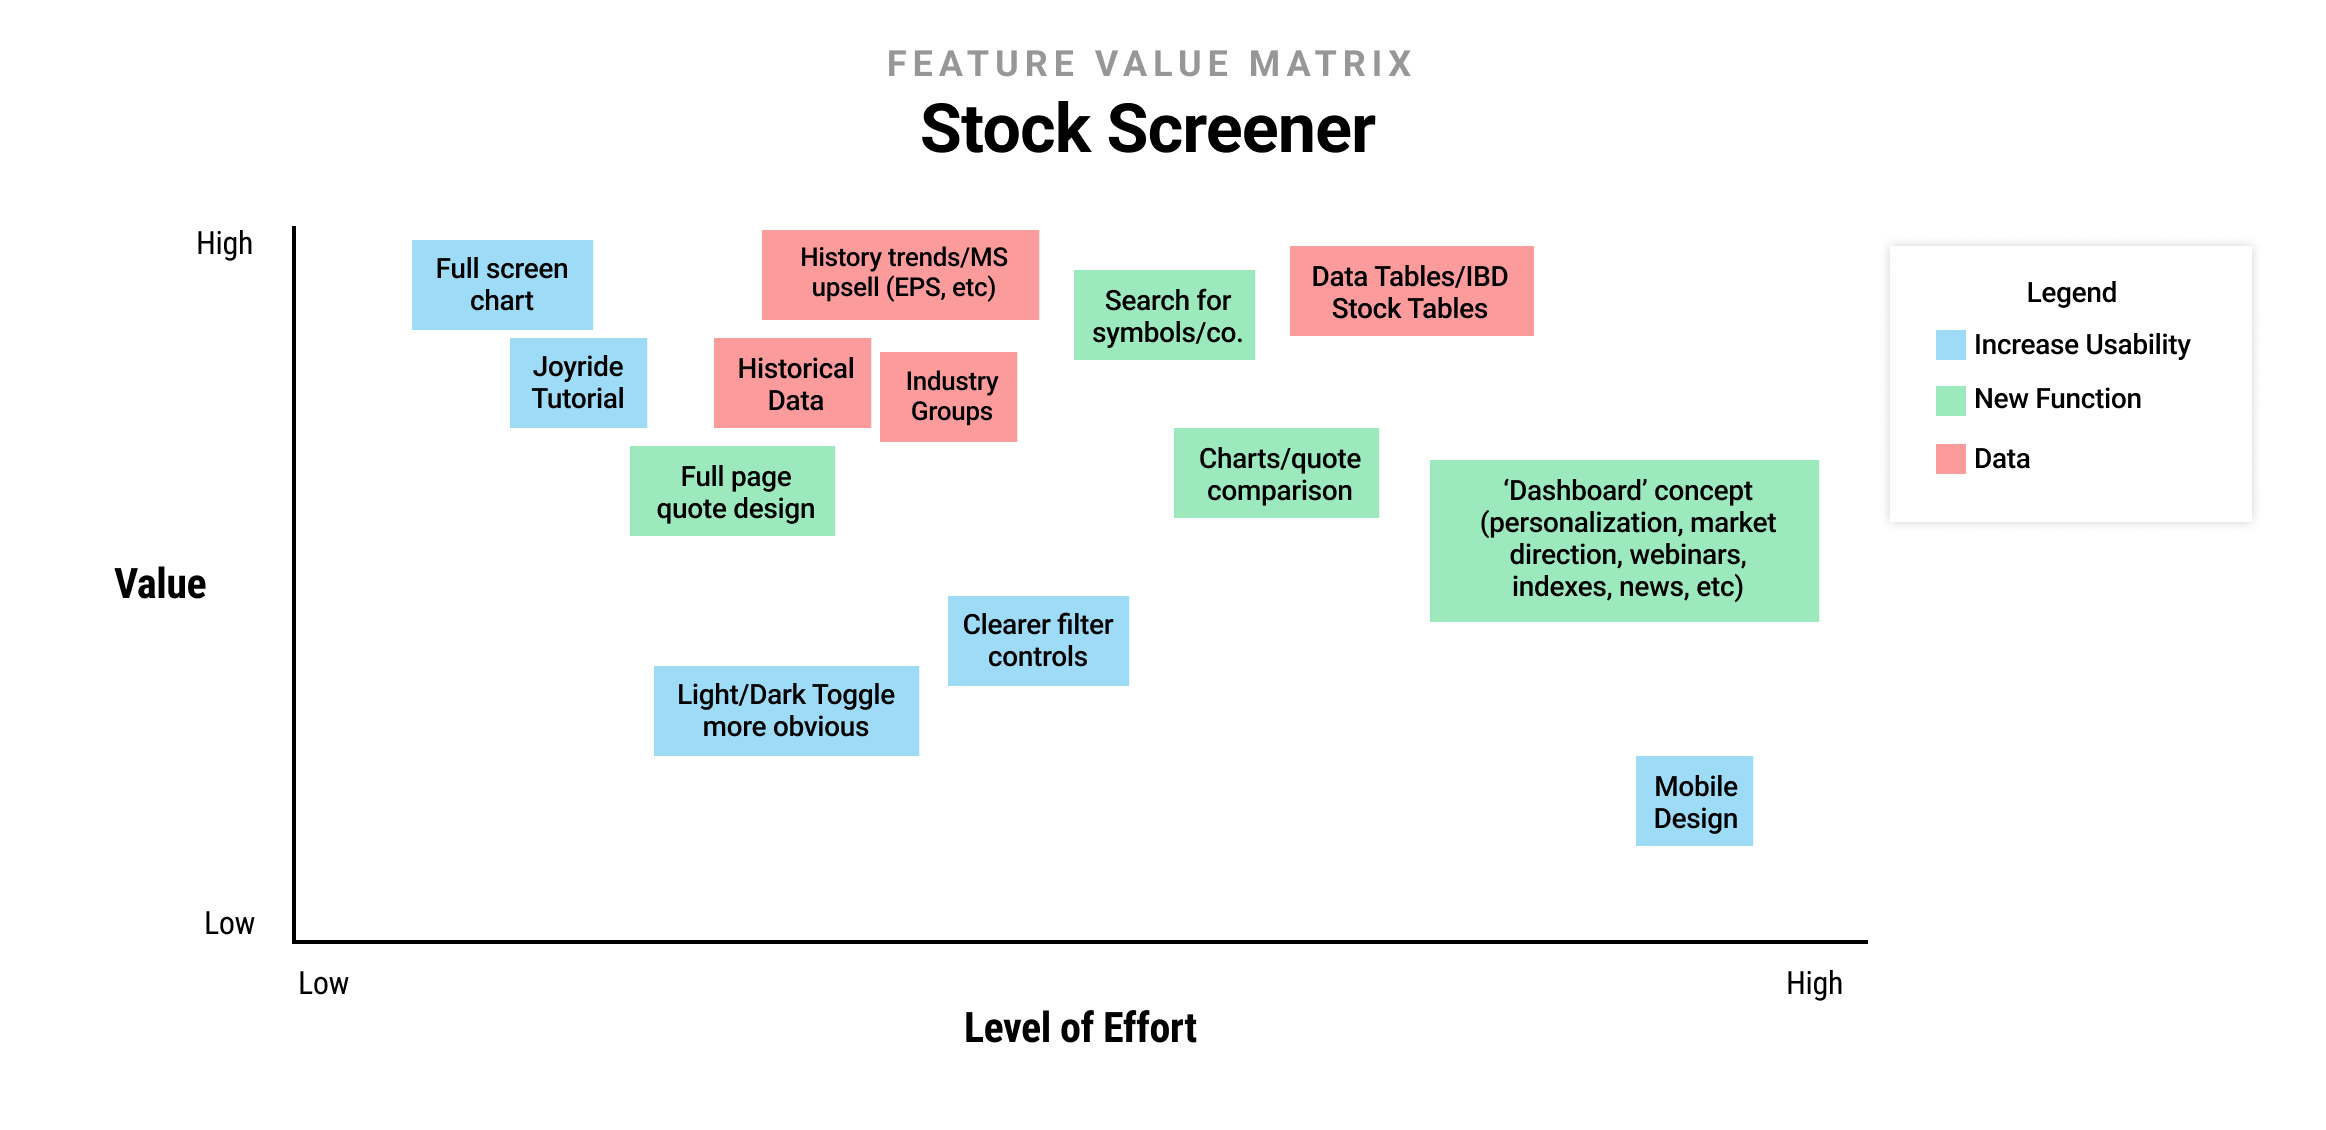
Feature Value Matrix
User Testing the Live Product
After months of designing, iterating, and working with engineers, a V1 of the stock screener was built and ready for launch. One last piece was to validate the live product (instead of a prototype).
To do this, we rented a location designed for testing, reached out to users in the Los Angeles area, and conducted moderated user testing. This was extremely valuable because the site we chose had a private viewing area where our entire executive team sat and watched the feedback in real time.


The Launch
The IBD Stock Screener was launched in October of 2018 and despite the lack of marketing push, users found their way to it and loved it. Users were spending almost quadruple the amount of time as an average IBD session. It also was also a top reason user’s gave when asked why they signed up for a subscription.